Analyze the given table:
|
May |
||||||
|
M |
T |
W |
T |
F |
S |
S |
|
|
1 |
2 |
3 |
4 |
5 |
6 |
|
7 |
8 |
9 |
10 |
11 |
12 |
13 |
|
14 |
15 |
16 |
17 |
18 |
19 |
20 |
|
21 |
22 |
23 |
24 |
25 |
26 |
27 |
|
28 |
29 |
30 |
31 |
|
|
|
|
|
|
|
|
The Bar diagram shows the 4 categories of students
studying Mathematics in grade 11 in Kathmandu below.


Bar Diagram/Pie-Chart/Line Graph Samples
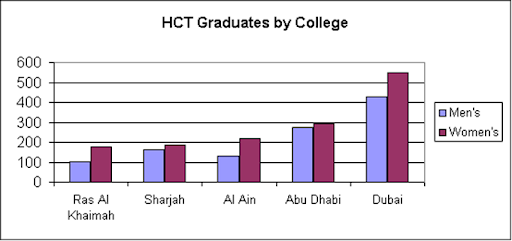
The chart shows male and female graduates from the UAE's Higher Colleges of Technology colleges.
The most outstanding feature of the graph
is female graduates outnumber males in all the colleges. For
example, in Dubai, there are 30% more women graduates than men. There are also
large differences between Al Ain and Ras Al Khaimah. However, the number of men
and women is almost equal in the colleges in Abu Dhabi. There
are also big differences in the sizes of the colleges. Ras Al Khaimah has less
than 300 students altogether, while Abu Dhabi has about 600 and Dubai has
almost 1000
In summary, women outnumber men in all the colleges, and
there are significant differences in the sizes of the colleges.

The graph shows how age and gender influence the frequency of heart attacks
in the US.
Less than 6% of all heart attacks occur in the 29-44 age group. The number
of women who suffer heart attacks in this group is negligible - only 3000
per year, compared to 123,000 men.
However, the proportion of men and women with heart attacks rises
dramatically between 45 and 64, with over half a million per year. Over 420,000
men a year in this age group have heart attacks. The incidence amongst women
increases - women have one heart attack for every three men in this age
group. Over the age of 65, the number of men suffering heart attacks only
increases slightly. However there is a huge increase in the number of women
with heart attacks - they comprise over 40% of all victims.
In conclusion, men are more likely to be the victims of heart attacks at all
ages, but women are increasingly likely over the age of 65.
Do the Following Exercise:
